The goal of xplainfi is to collect common feature importance methods under a unified and extensible interface.
It is built around mlr3 as available abstractions for learners, tasks, measures, etc. greatly simplify the implementation of importance measures.
Installation
Install xplainfi from CRAN:
install.packages("xplainfi")Or install from R-universe:
install.packages("xplainfi", repos = c("https://mlr-org.r-universe.dev", "https://cloud.r-project.org"))The latest development version of xplainfi can be installed with pak:
# install.packages(pak)
pak::pak("mlr-org/xplainfi")
Example: PFI
Here is a basic example on how to calculate PFI for an untrained learner and task, using cross-validation for resampling and computing PFI within each resampling iteration 10 times on the friedman1 task (see ?mlbench::mlbench.friedman1).
The friedman1 task has the following structure:
\[y = 10 \sin(\pi x_1 x_2) + 20(x_3 - 0.5)^2 + 10x_4 + 5x_5 + \varepsilon\]
Where \(x_{\{1,2,3,4,5\}}\) are named important1 through important5 in the Task, with additional numbered unimportant features without effect on \(y\).
library(xplainfi)
library(mlr3learners)
#> Loading required package: mlr3

task = tgen("friedman1")$generate(1000)
learner = lrn("regr.ranger", num.trees = 100)
measure = msr("regr.mse")

pfi = PFI$new(
    task = task,
    learner = learner,
    measure = measure,
    resampling = rsmp("cv", folds = 3),
    n_repeats = 30
)
Compute and print PFI scores:
pfi$compute()
pfi$importance()
#> Key: <feature>
#>          feature   importance
#>           <char>        <num>
#>  1:   important1  8.183995584
#>  2:   important2  7.481268675
#>  3:   important3  1.571760349
#>  4:   important4 12.585739572
#>  5:   important5  2.810875567
#>  6: unimportant1  0.030667439
#>  7: unimportant2 -0.002837696
#>  8: unimportant3 -0.044922079
#>  9: unimportant4 -0.060054450
#> 10: unimportant5  0.060148388
If it aids interpretation, importances can also be calculated as the ratio rather than the difference between the baseline and post-permutation losses:
pfi$importance(relation = "ratio")
#> Key: <feature>
#>          feature importance
#>           <char>      <num>
#>  1:   important1  2.6987668
#>  2:   important2  2.5598945
#>  3:   important3  1.3294180
#>  4:   important4  3.6278508
#>  5:   important5  1.5874860
#>  6: unimportant1  1.0067957
#>  7: unimportant2  0.9994507
#>  8: unimportant3  0.9905990
#>  9: unimportant4  0.9874657
#> 10: unimportant5  1.0126572
When PFI is computed based on resampling with multiple iterations, and / or multiple permutation iterations, the individual scores can be retrieved as a data.table:
str(pfi$scores())
#> Classes 'data.table' and 'data.frame': 900 obs. of 6 variables:
#> $ feature : chr "important1" "important1" "important1" "important1" ...
#> $ iter_rsmp : int 1 1 1 1 1 1 1 1 1 1 ...
#> $ iter_repeat : int 1 2 3 4 5 6 7 8 9 10 ...
#> $ regr.mse_baseline: num 4.56 4.56 4.56 4.56 4.56 ...
#> $ regr.mse_post : num 12.3 11.9 11.3 12.1 13.6 ...
#> $ importance : num 7.77 7.33 6.74 7.56 9.06 ...
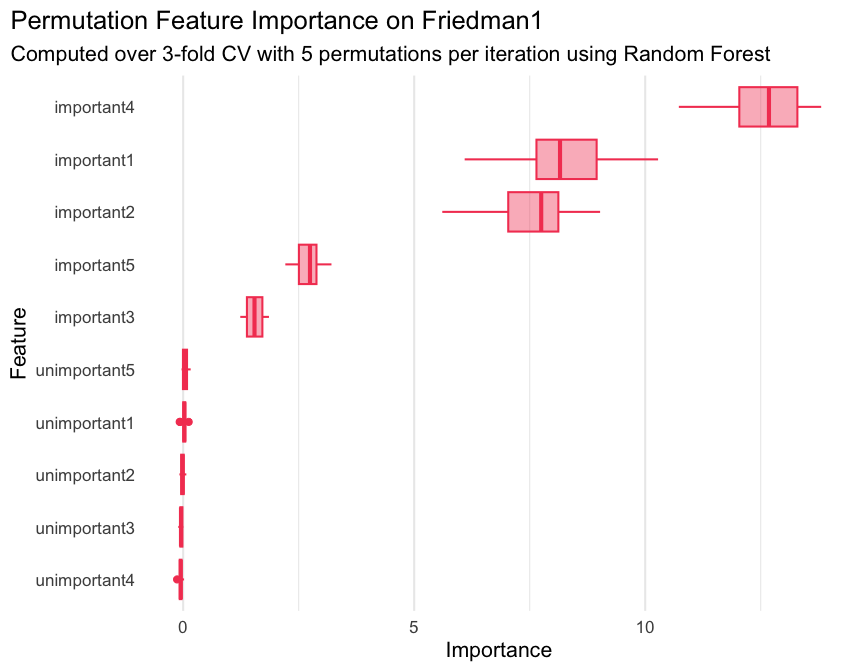
#> - attr(*, ".internal.selfref")=<externalptr>Where iter_rsmp corresponds to the resampling iteration, i.e., 3 for 3-fold cross-validation, and iter_repeat corresponds to the permutation iteration within each resampling iteration, 5 in this case. While pfi$importance() contains the means across all iterations, pfi$scores() allows you to manually visualize or aggregate them in any way you see fit.
For example:
library(ggplot2)

ggplot(
    pfi$scores(),
    aes(x = importance, y = reorder(feature, importance))
) +
    geom_boxplot(color = "#f44560", fill = alpha("#f44560", 0.4)) +
    labs(
        title = "Permutation Feature Importance on Friedman1",
        subtitle = "Computed over 3-fold CV with 5 permutations per iteration using Random Forest",
        x = "Importance",
        y = "Feature"
    ) +
    theme_minimal(base_size = 16) +
    theme(
        plot.title.position = "plot",
        panel.grid.major.y = element_blank()
    )
If the measure in question needs to be maximized rather than minimized (like \(R^2\)), the internal importance calculation takes that into account via the $minimize property of the measure and calculates importances such that the intuition “performance improvement” -> “higher importance score” still holds:
pfi = PFI$new(
    task = task,
    learner = learner,
    measure = msr("regr.rsq")
)
#> ℹ No <Resampling> provided, using `resampling = rsmp("holdout", ratio = 2/3)`
#>   (test set size: 333)

pfi$compute()
pfi$importance()
#> Key: <feature>
#>          feature   importance
#>           <char>        <num>
#>  1:   important1  0.329915393
#>  2:   important2  0.297695022
#>  3:   important3  0.063613087
#>  4:   important4  0.493673768
#>  5:   important5  0.121794662
#>  6: unimportant1  0.003972813
#>  7: unimportant2  0.002157623
#>  8: unimportant3 -0.002780577
#>  9: unimportant4  0.001914150
#> 10: unimportant5  0.001366645
See vignette("xplainfi") for more examples.